How to Explore WordPress Hooks and Callbacks
WordPress runs on hooks: actions and filters. When a plugin changes output unexpectedly, fires too early, or fights another plugin, the question is always the same — what is registered on this hook, and who owns it?
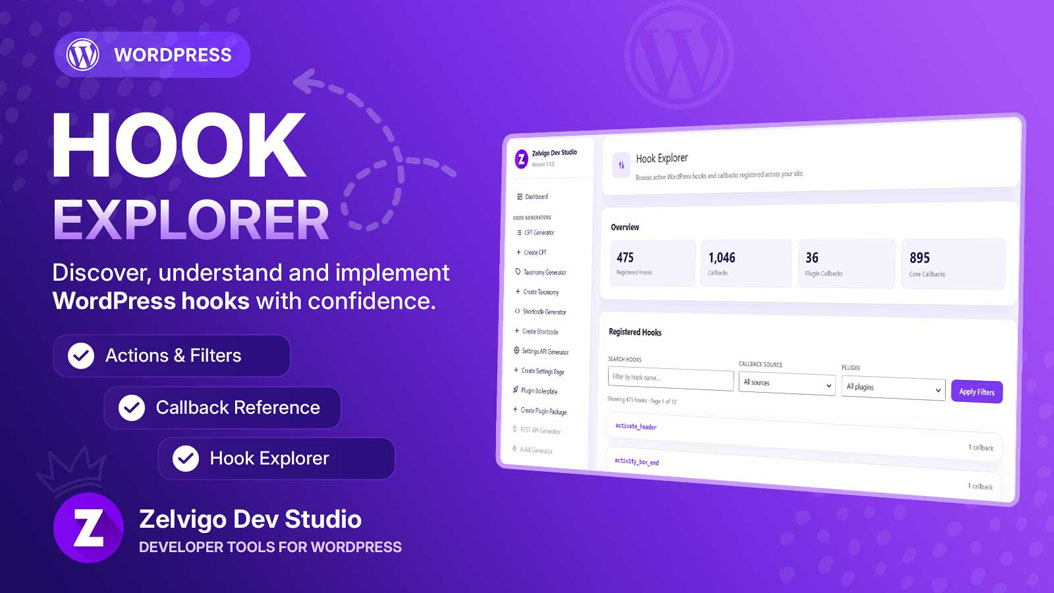
This post explains how to think about hooks while debugging, and how Hook Explorer in Zelvigo Dev Studio lists callbacks with priority, source, and file location. It’s a local tool (no Pro license). Product page: Hook Explorer.
Actions vs filters (30-second refresh)
- Actions — “do something at this moment” (
add_action) - Filters — “change this value before it’s used” (
add_filter)
Both use priorities. Lower numbers run earlier. When two plugins hook the same place, priority and load order decide the winner.
What Hook Explorer shows
- Total hooks and callbacks
- Breakdown by source: core, plugin, theme, mu-plugin
- Search by hook name
- Filter by callback source or a specific plugin
- Per callback: priority, callable name, accepted args, file location when available
Open Zelvigo Dev Studio → Hook Explorer.
Practical debugging workflow
- Reproduce the bug
- Check Debug Log Viewer for PHP errors
- Guess the relevant hook (or search docs / source)
- In Hook Explorer, search that hook and inspect priorities + plugin sources
- Disable or adjust the offending callback — or change your own priority
A dedicated Plugin Conflict Detector is on the roadmap. Hook Explorer + debug log cover a lot of cases today.
Is this a hook code generator?
No. Hook Explorer inspects registered hooks. It does not generate add_action / add_filter scaffolds (that may come later). For generating plugin structure today, use the cloud generators — CPT, taxonomy, settings, shortcode, and boilerplate.
Docs: zelvigo.com/documentation.
Next step
When a hook behaves oddly, don’t guess which plugin owns it. Look it up, check priority, fix with evidence.